Climate-Driven Vulnerability Assessment of Hamilton’s Urban Forest:
A Ward-Level Resilience Framework for 2030, 2050, and 2080


| Vulnerability Score = Exposure + Sensitivity − Adaptive Capacity (IPCC AR5 Vulnerability Conceptual framework) |
|||
|---|---|---|---|
| Exposure | Magnitude of climate stress experienced by trees and urban areas | Extreme Heat Intensity (ΔTXx): change in annual maximum daily temperature during summer. Heat index = Σ (Population_category × ISA Impervious Surface Weight) |
Spatial scale: City & Ward Levels |
| Sensitivity (1 − Resilience score) |
Species-level susceptibility to climate stress | Heat (AHS Temp >30°C), Hydroclimate (Drought + Saturated Soil Tolerance), Pollution Tolerance, Climate Suitability | Species-Level susceptibility to climate stress |
| Adaptive Capacity | Ecosystem ability to cope with environmental stress | DBH (Diameter at Breast Height). Larger trees exhibit greater resistance through deeper root systems and higher biomass. | Individual Tree Level |
| *Higher Vulnerability Scores indicate greater climate risk to the urban forest.* *All the datasets used in this analysis originates from well-established and widely recognized government-affiliated sources.* |
|||
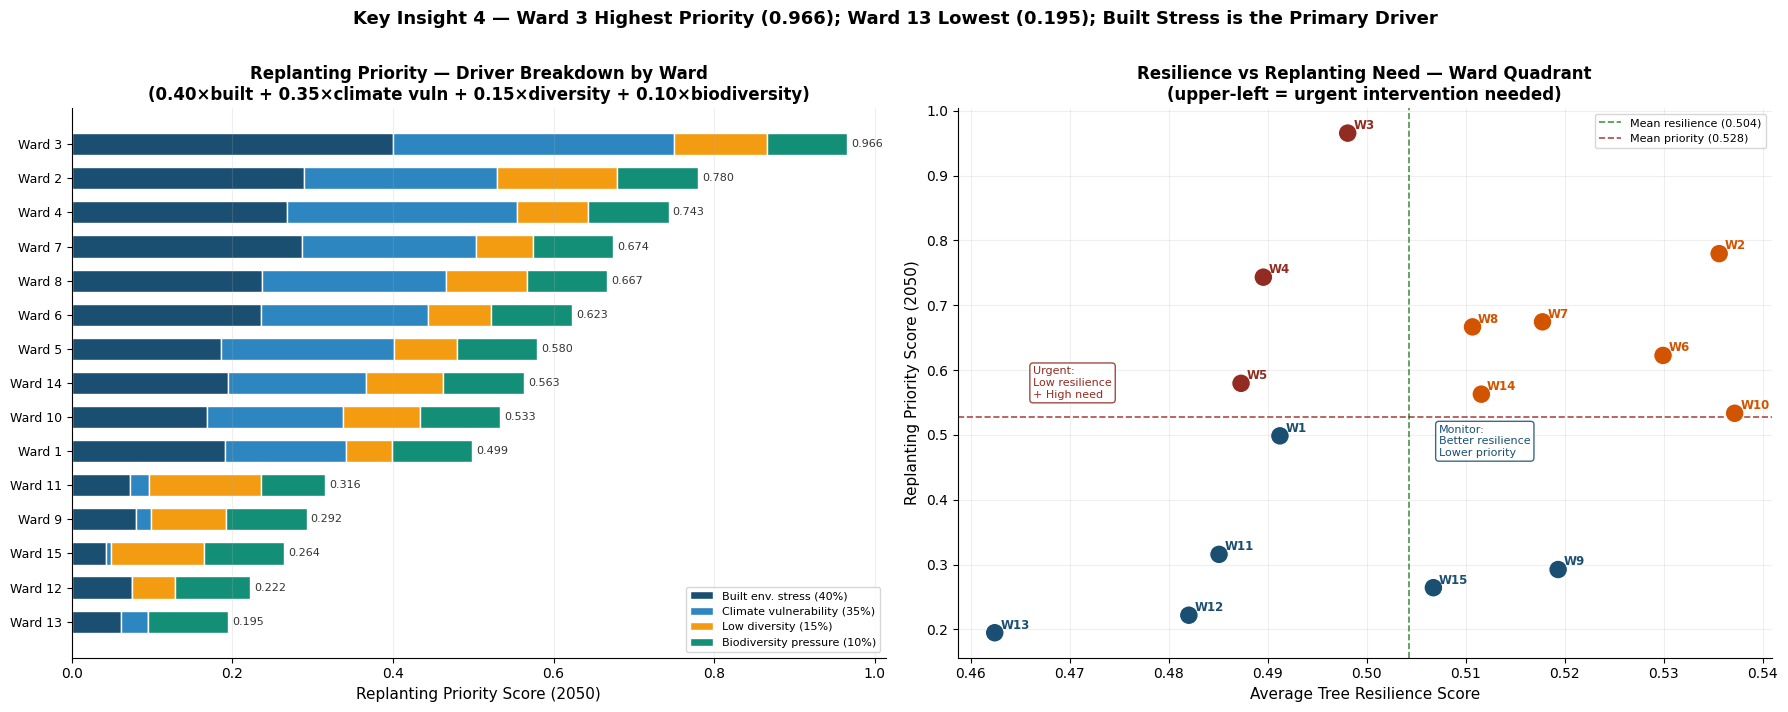
[Built Environment Stress + Ward Vulnerability Score + Low Diversity Pressure + Biodiversity Pressure]
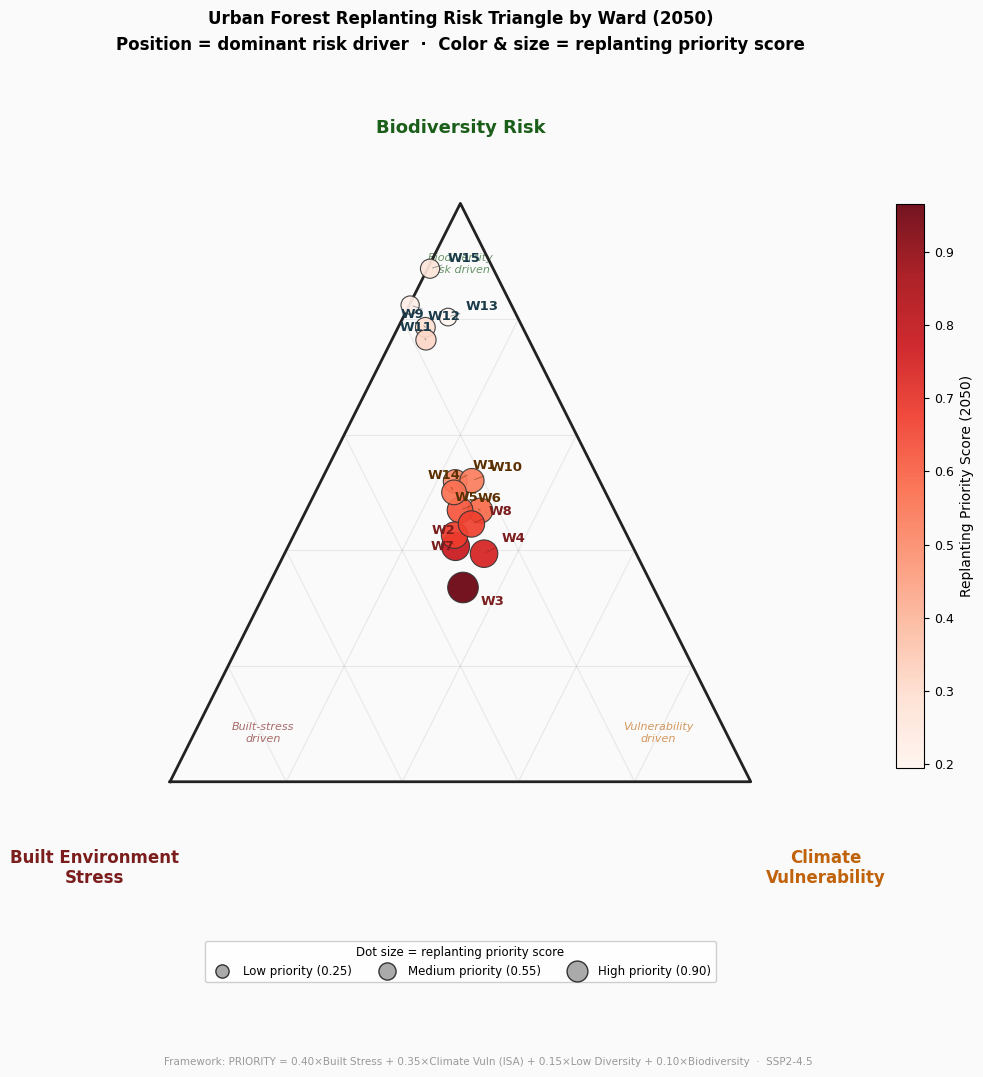
Ward position reflects the dominant driver of 2050 replanting priority.
Wards 9, 11, 12, 13, and 15 cluster toward biodiversity risk, indicating higher species dominance and lower diversity.
Wards 2, 3, 4, and 7 show mixed drivers, where built‑environment stress and biodiversity pressure combine.
Ward 3 has the highest replanting priority (0.966) due to intense built‑environment heat exposure.
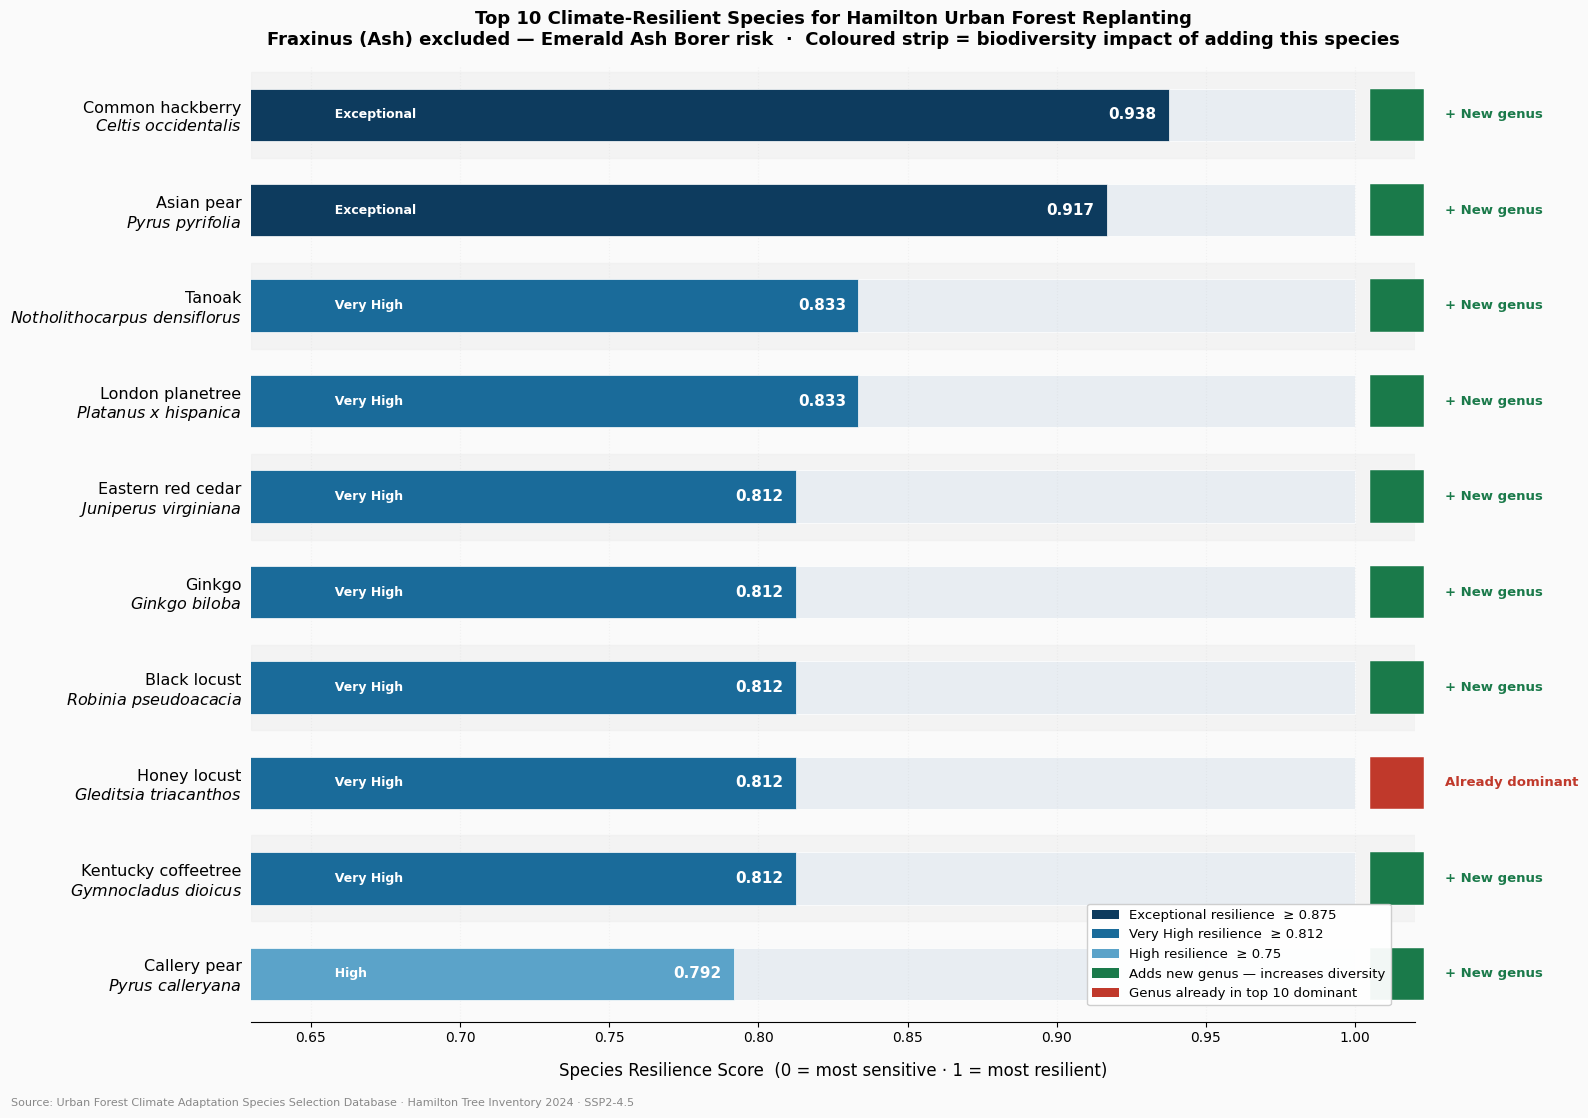
Replanting recommendations prioritize climate-resilient species for vulnerable wards.
Common hackberry (0.938) and Asian pear (0.917) show the highest resilience.
9 of 10 species belong to new genera, reducing reliance on Acer.
Fraxinus (ash) excluded due to Emerald Ash Borer risk.
Supports climate resilience and biodiversity diversification.
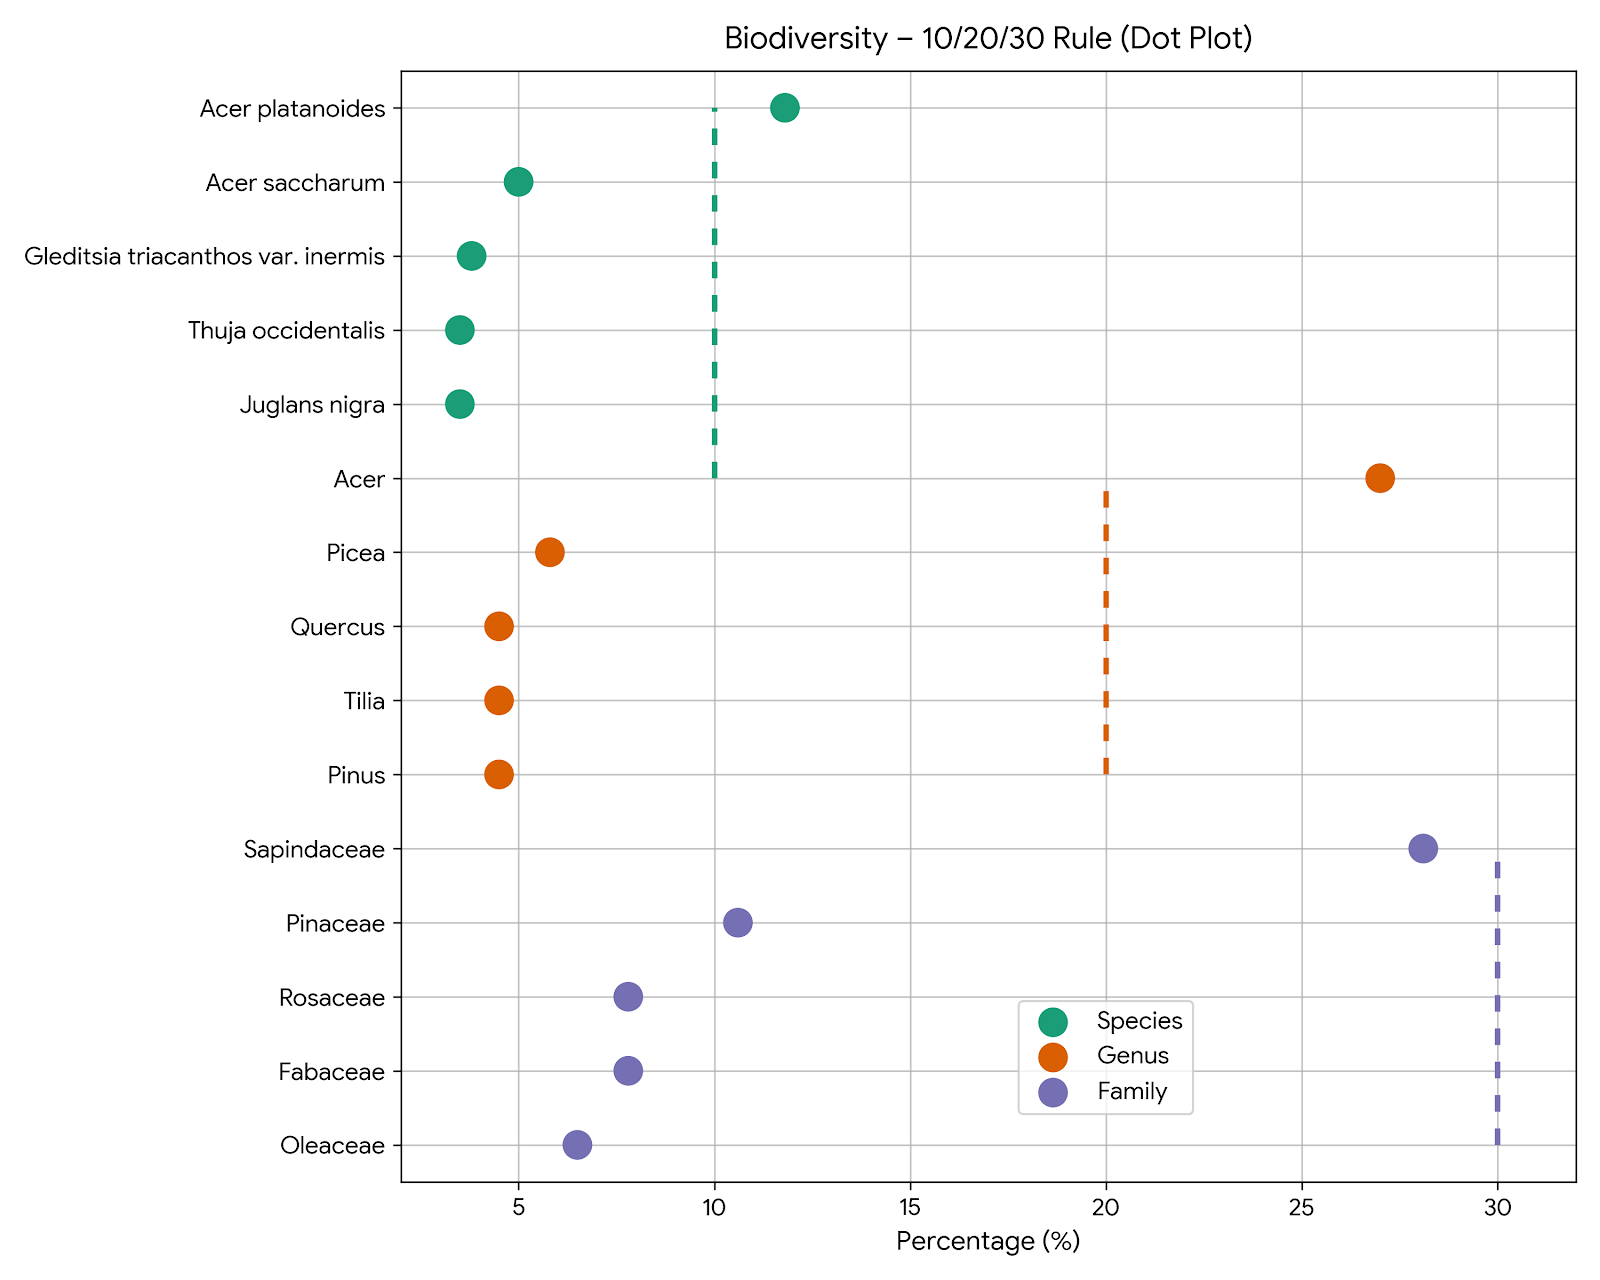
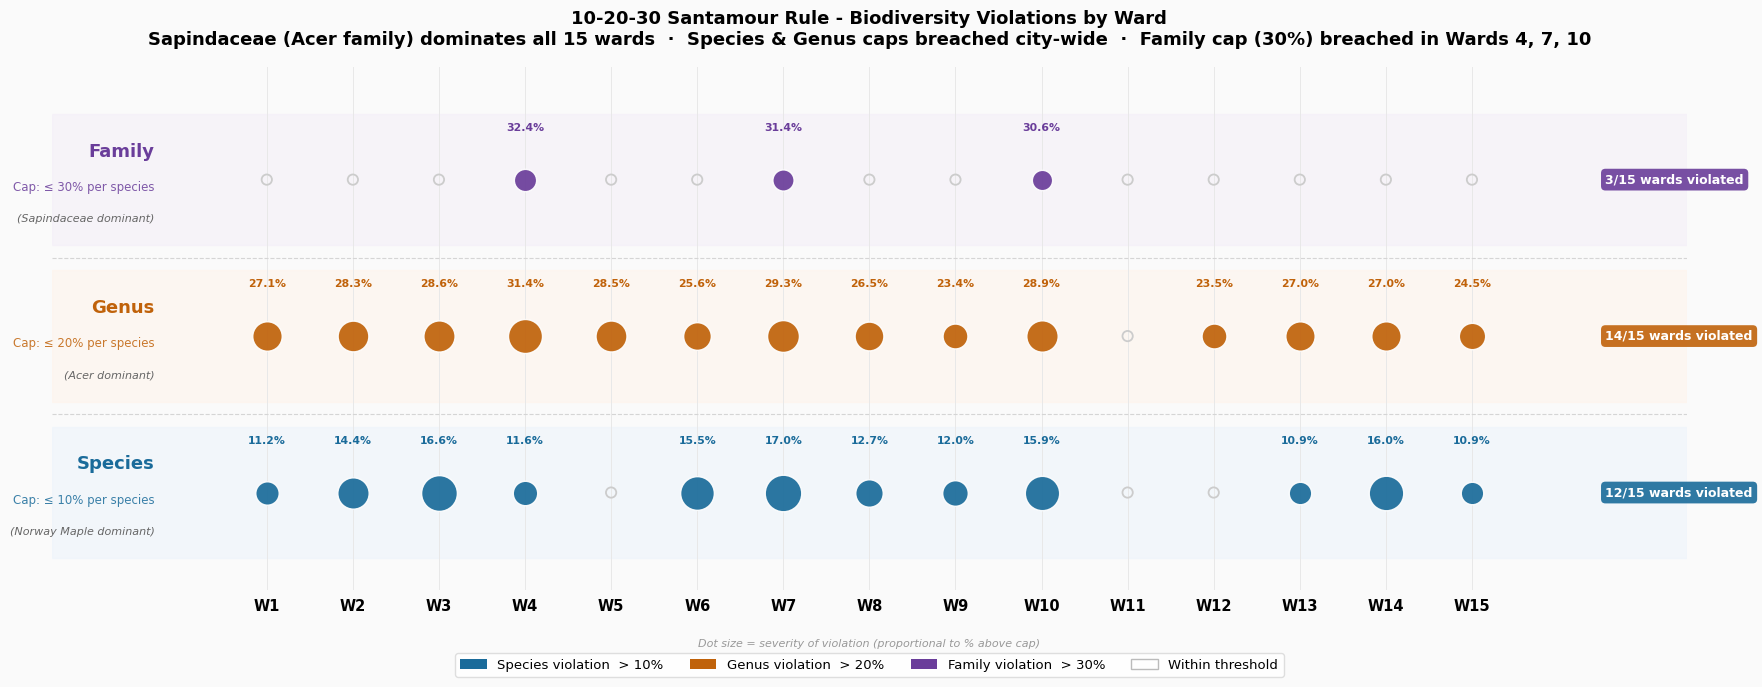
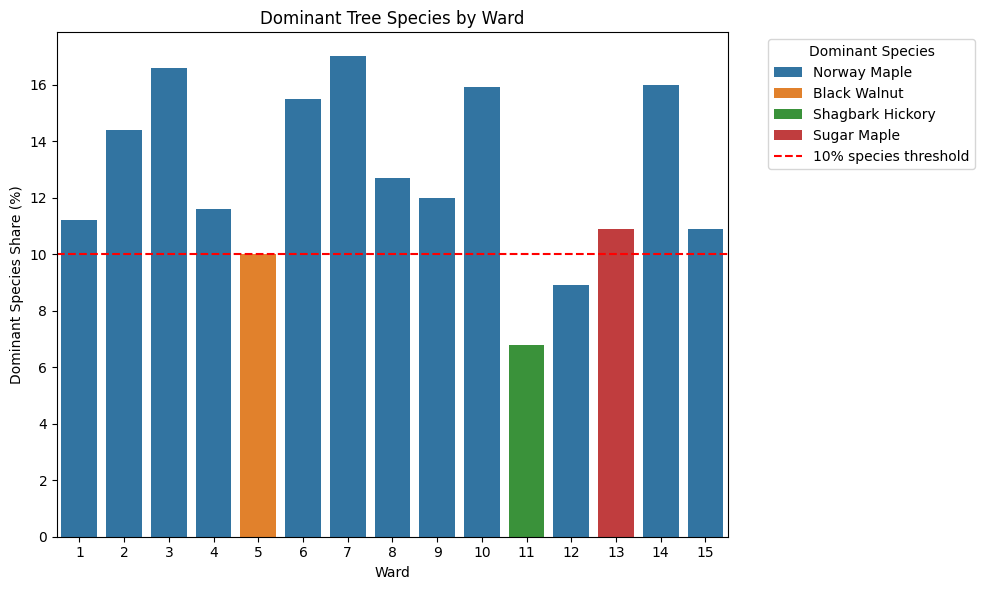
The Santamour guideline recommends that no single species exceed 10%, no genus exceed 20%, and no family exceed 30% of the urban forest composition.
Points located to the right of the dashed thresholds indicate biodiversity dominance exceeding the 10/20/30 guideline.
City-Level: Acer platanoides (Norway maple) exceeds the 10% species threshold, and the Acer genus exceeds the 20% genus threshold. The Sapindaceae family is approaching the 30% family dominance threshold. Ward 4 is the only ward with two species violating the rule.
Dominance of Acer platanoides increases systemic risk because monoculture urban forests are more susceptible to pest outbreaks and climate stress.
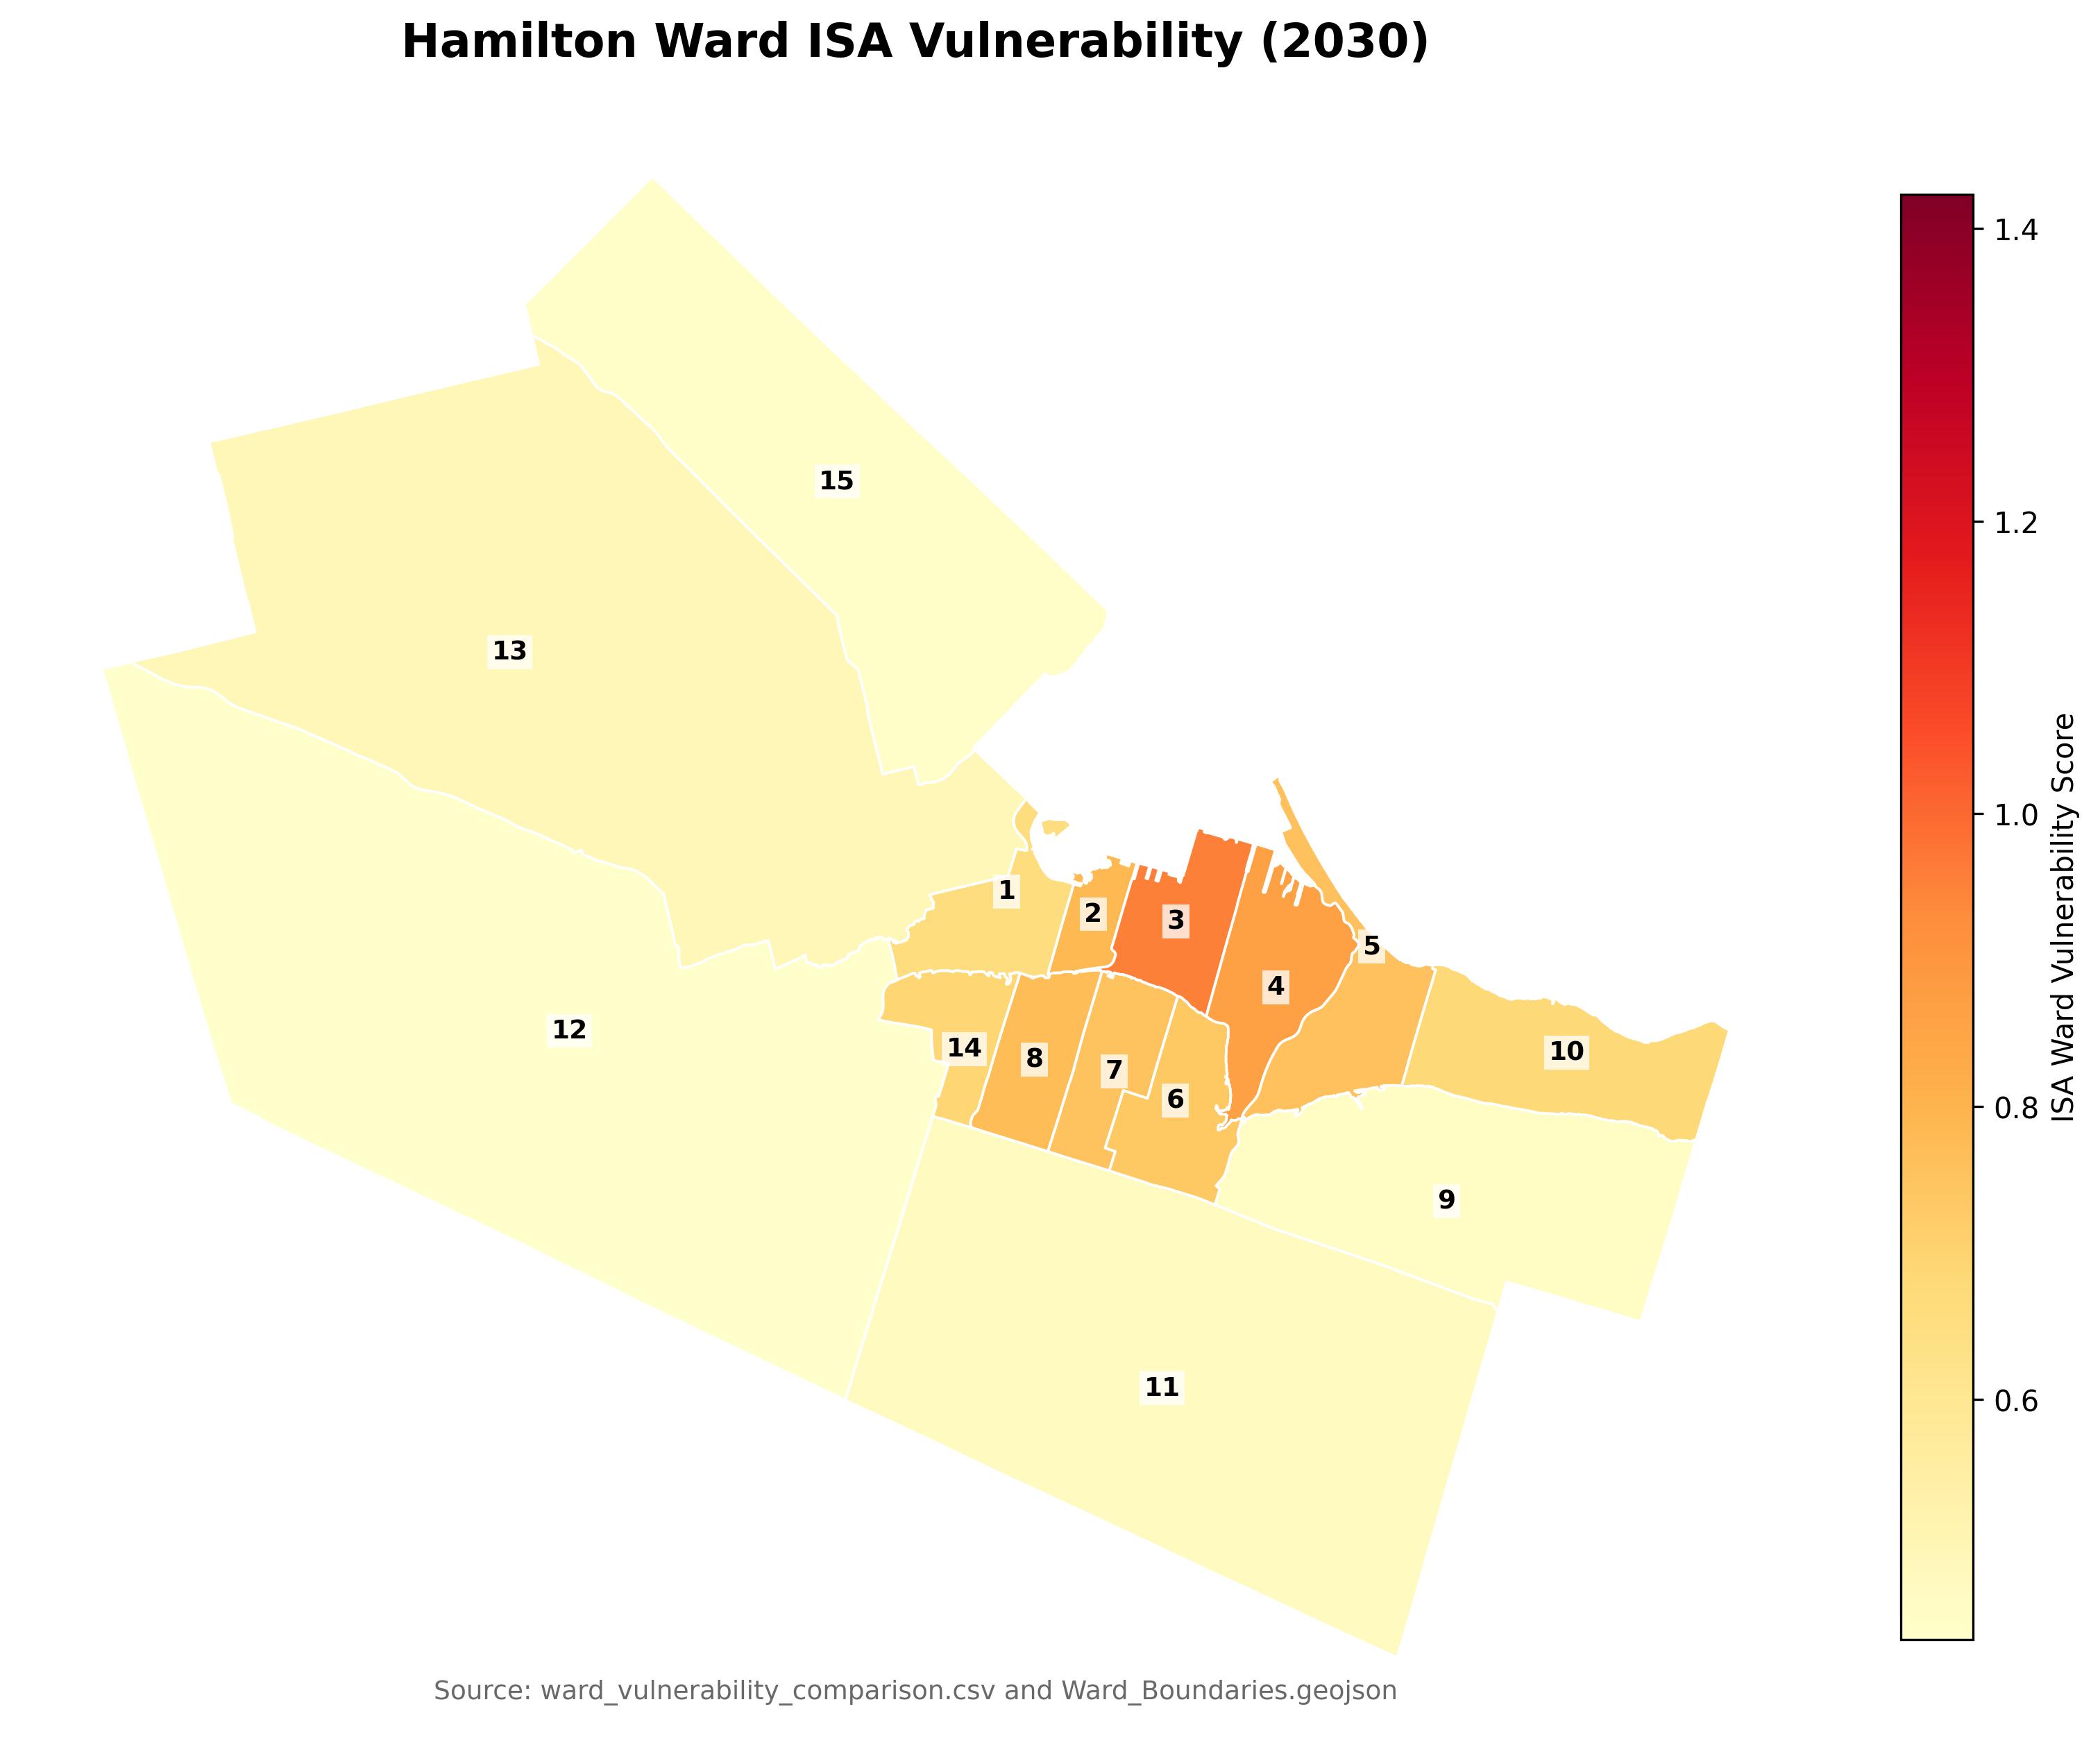
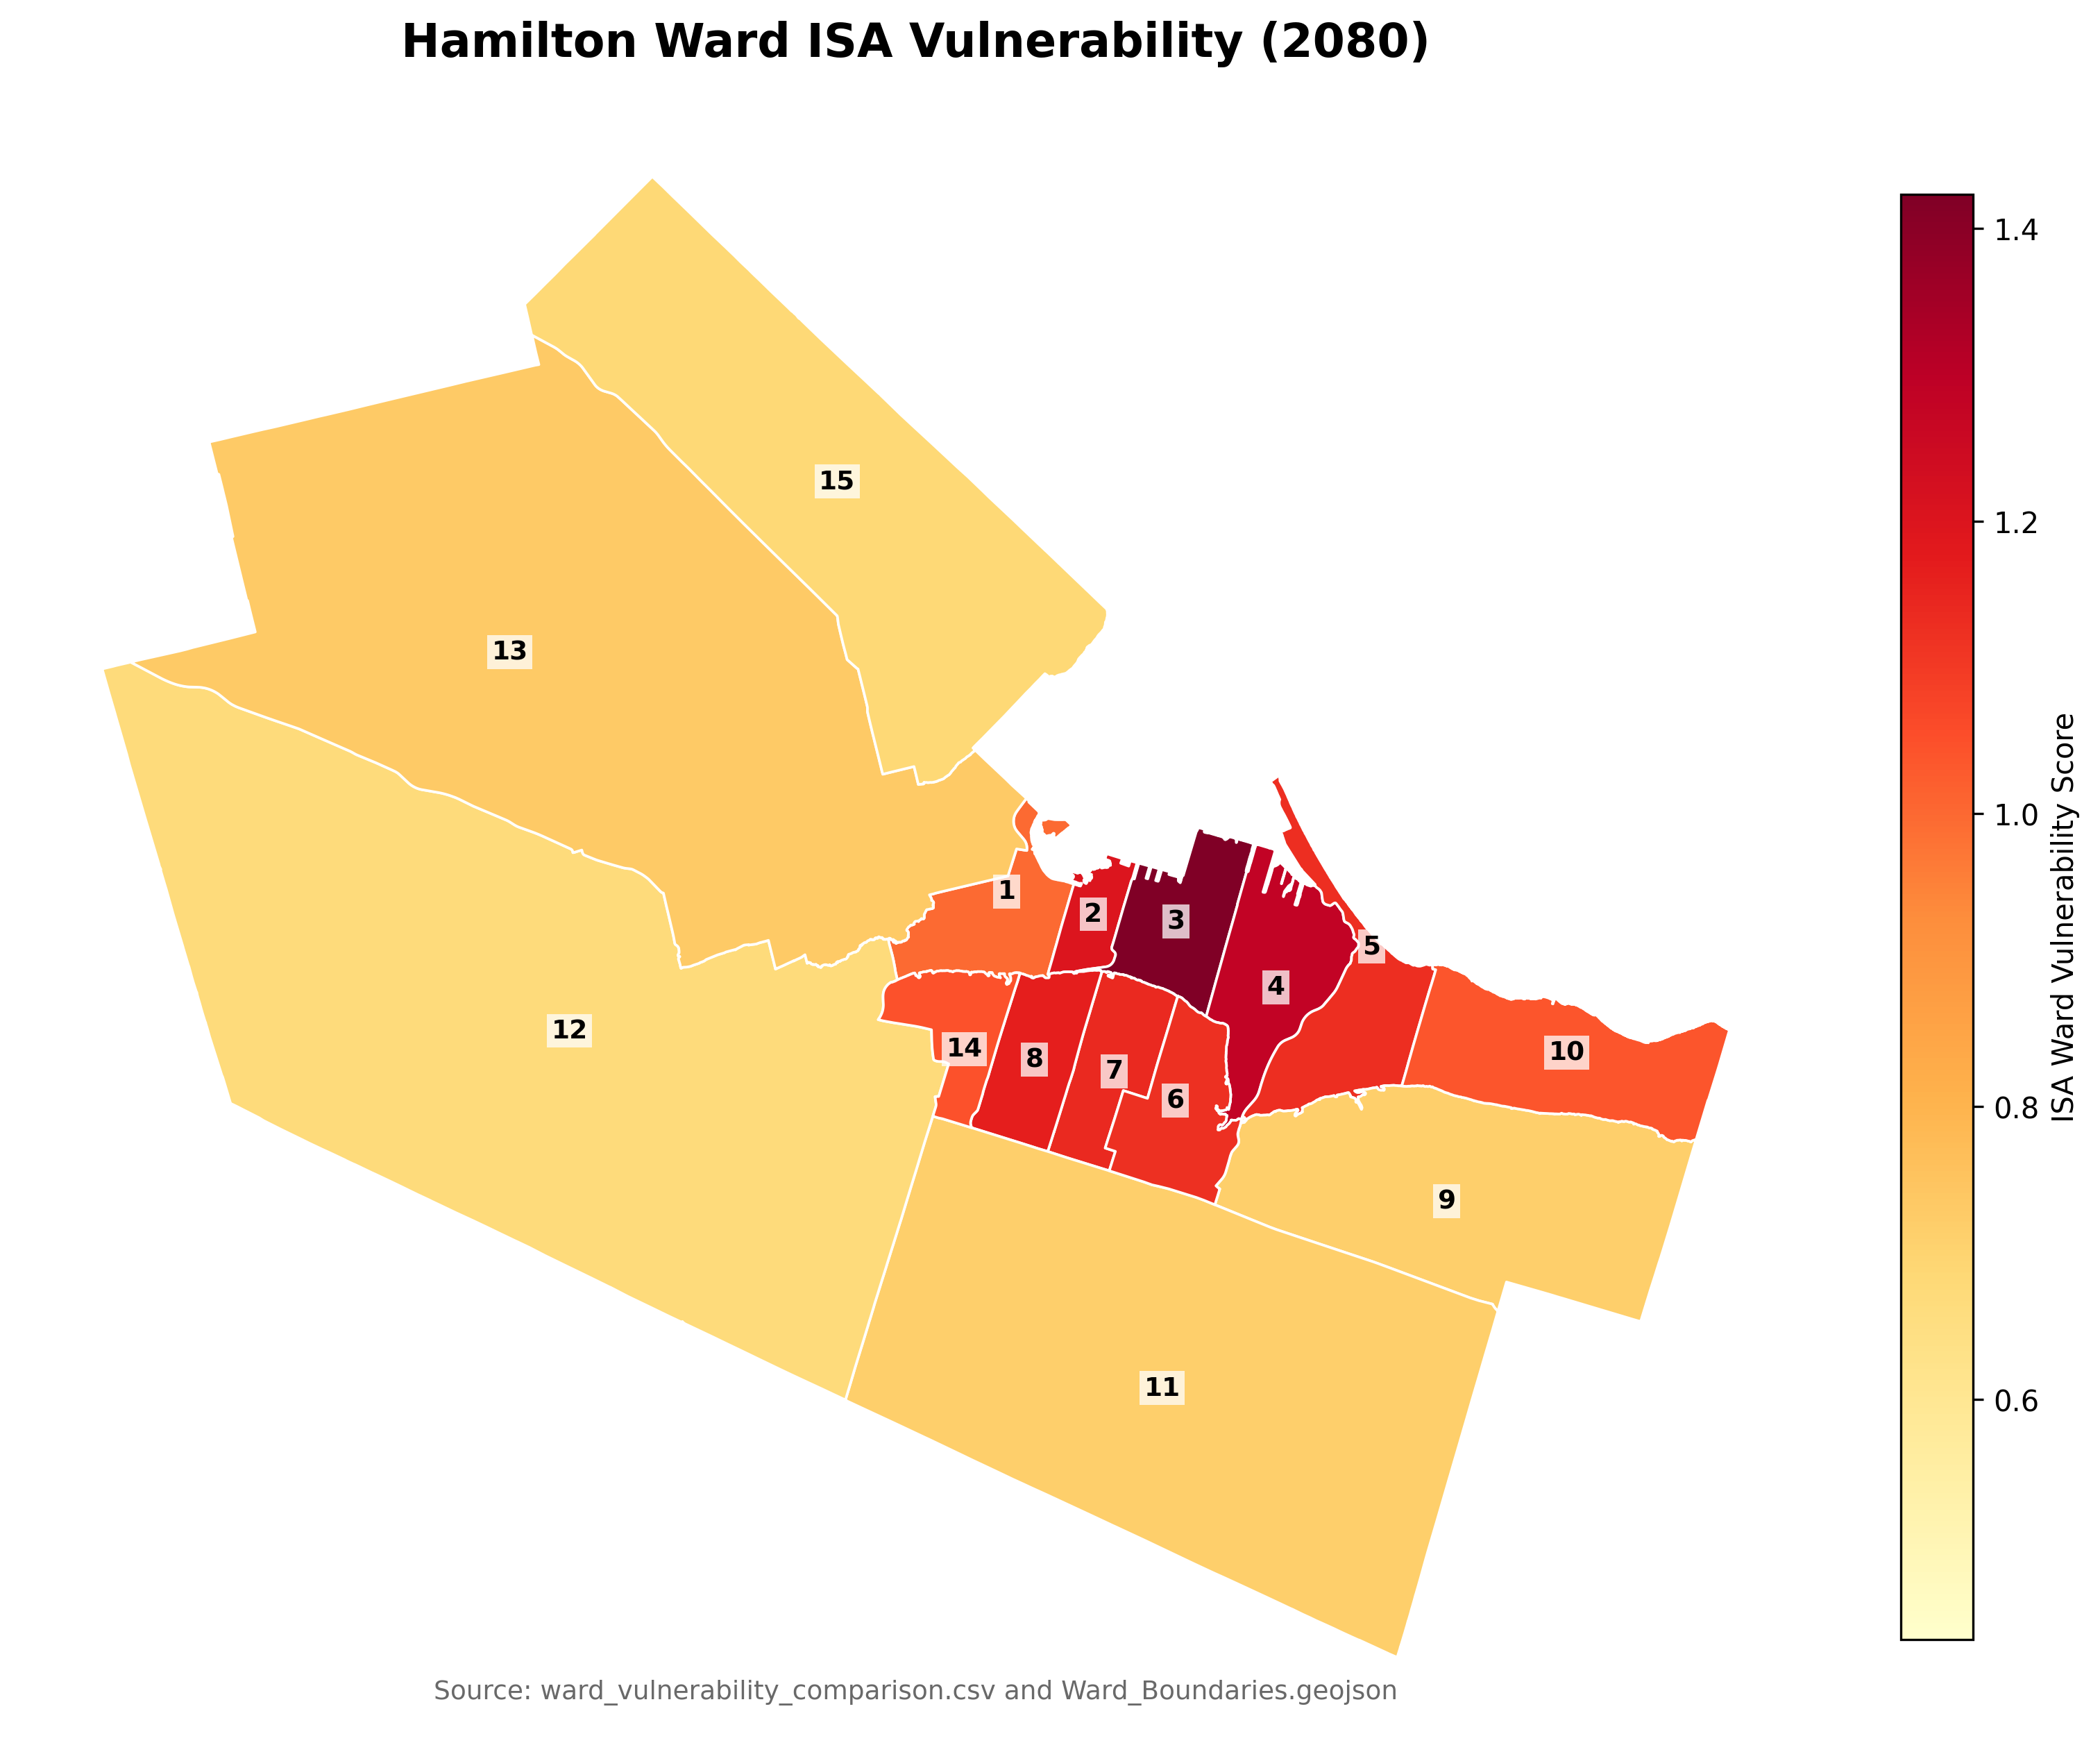
Highest vulnerability:
Prioritize climate adaptation in high-risk wards.
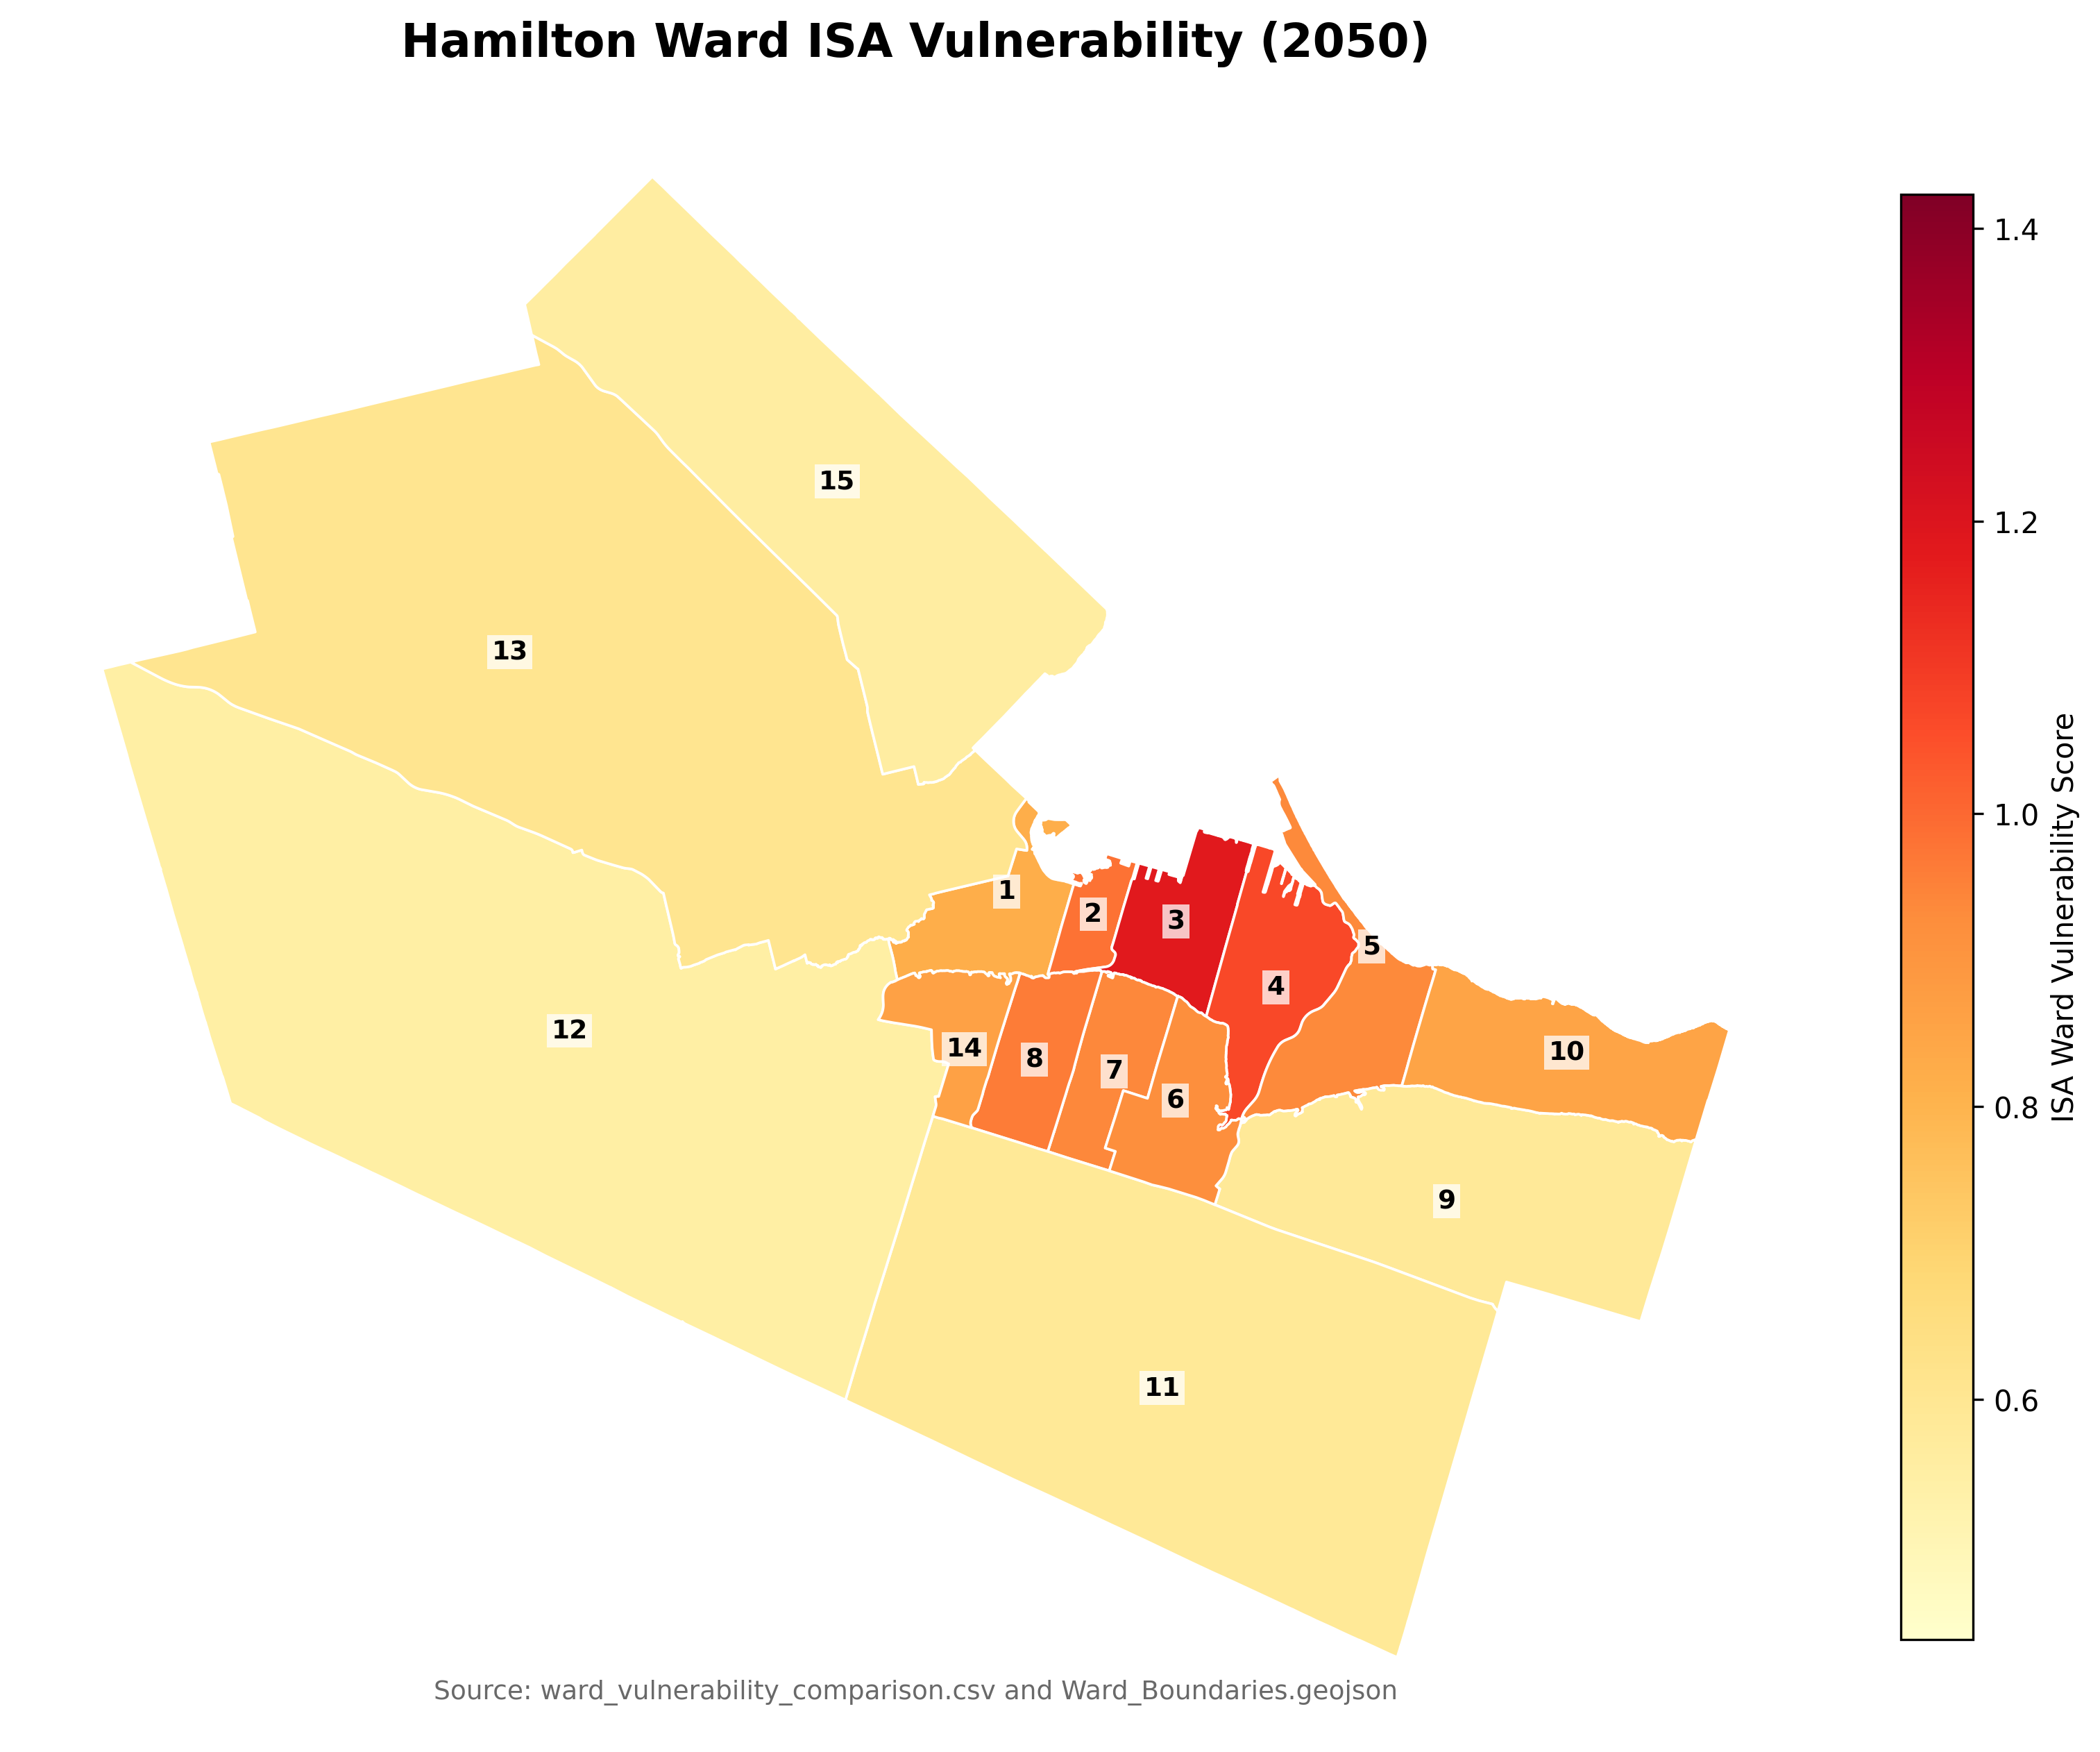
Ward 3 ranks highest across all climate horizons, driven by the city’s highest impervious-surface heat exposure (ISA index = 1.0 normalized).
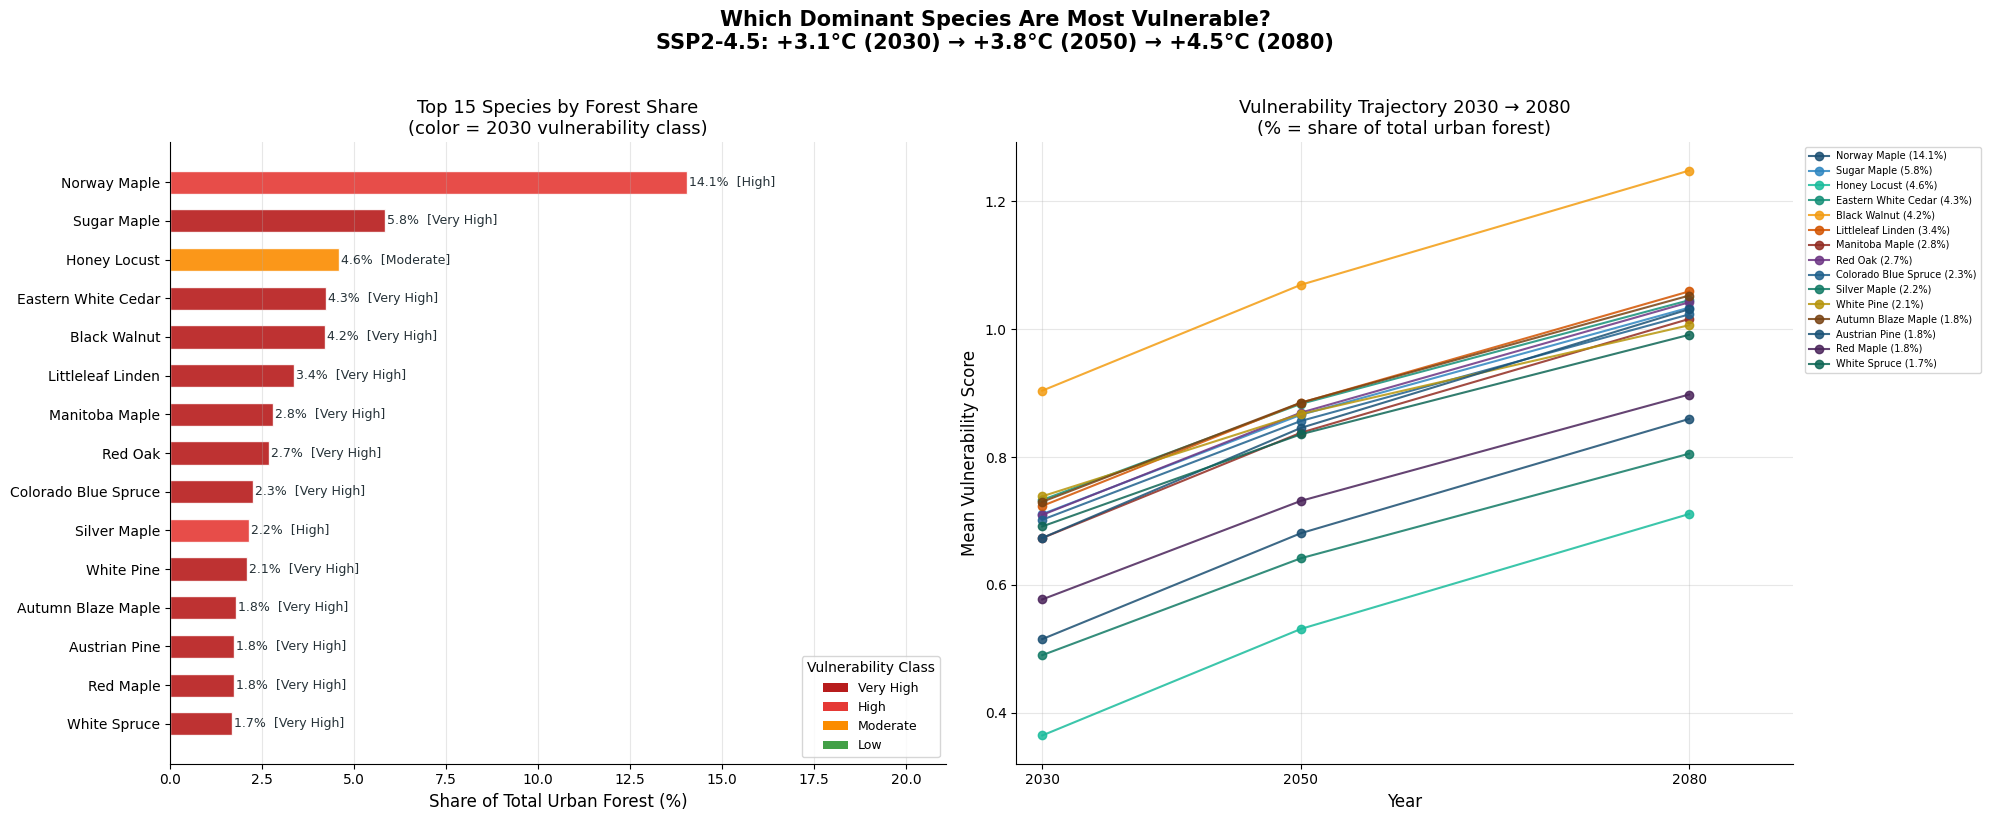
Biodiversity risk:
Reduce dependence on dominant maple species.
Norway Maple represents 11.9%, of the urban forest, exceeding the 10% Santamour cap. Acer genus exceeds the 20% limit in 14 of 15 wards (Ward 4: 31%, Ward 3 & 7: ~29%).
Safest wards:
Wards 9, 11, 12, 13, 15: lowest vulnerability, lowest built share, lowest road stress.
Ash risk: 9,170 Fraxinus trees (3.3% of the inventory) are highly vulnerable to Emerald Ash Borer, posing a significant future canopy loss risk. Fraxinus species are excluded from recommended replanting.